Note: This vignette is illustrated with fake data. The dataset explored in this example should not be used to inform decision-making. Some of the methods illustrated in this EQ-5D vignette are described in more detail in a vignette about scoring AQoL-6D health utility. Furthermore, the synthetic data and model types used in this data have not been optimised for the purposes of this example (the models created below perform poorly as a result).
EQ-5D scoring
The eq5d package
provides a toolkit for scoring EQ-5D health utility. The
scorz package contains ready4
framework modules that integrate eq5d package tools with the readyforwhatsnext youth mental
health economic model.
Ingest and describe data
To begin, we ingest an unscored dataset and its data dictionary as a Ready4useDyad. We then add additional details about the dataset (unique identifier and data-collection round variable name and values) by converting the ingested data to an instance of the (YouthvarsSeries module)[https://www.ready4-dev.com/docs/model/modules/using-modules/people/add-metadata/].
X <- ready4use::Ready4useRepos(dv_nm_1L_chr = "fakes",
                               dv_ds_nm_1L_chr = "https://doi.org/10.7910/DVN/W95KED",
                               dv_server_1L_chr = "dataverse.harvard.edu") %>%
  ingest(fls_to_ingest_chr = "ymh_eq5d_dyad_r4",
         metadata_1L_lgl = F)
X <- youthvars::YouthvarsSeries(a_Ready4useDyad = X,
                                id_var_nm_1L_chr = "uid",
                                timepoint_var_nm_1L_chr = "Timepoint",
                                timepoint_vals_chr = unique(X@ds_tb$Timepoint))
We now use the data and meta-data we have created in the previous
steps to create an instance of the ScorzEuroQol5 class.
Important arguments to specify when creating a
ScorzEuroQol5 instance are country_1L_chr (the
country preference weights to use),
instrument_version_1L_chr (instrument version) and the
itm_var_nms_chr (item variable names - these must
be in the exact order that corresponds to the Movement, Self-care, Usual
Activities, Pain/Discomfort and Anxiety Depression
domains).
Y <- ScorzEuroQol5(a_YouthvarsProfile = X,
                   country_1L_chr = "UK",
                   instrument_version_1L_chr = "5L",
                   itm_var_nms_chr = c("eq5dq_MO", "eq5dq_SC", "eq5dq_UA", "eq5dq_PD", "eq5dq_AD"))
Calculating scores
To calculate EQ-5D adolescent utility scores, use the
renew method.
Y <- renew(Y)Viewing the updated dataset
We can inspect our updated dataset using the exhibit
method.
| Unique identifier | Data collection round | Date of data collection | Age | Gender (grouped) | Sex at birth | Sexual orientation | Relationship status | Aboriginal or Torres Strait Islander | Culturally And Linguistically Diverse | Region of residence (metropolitan or regional) | Education and employment status | EQ5D - Mobility domain score | EQ5D - Self-Care domain score | EQ5D - Usual Activities domain score | EQ5D - Pain / Discomfort domain score | EQ5D - Anxiety / Depression domain score | Kessler Psychological Distress - 10 Item Total Score | Overall Wellbeing Measure (Winefield et al. 2012) | EuroQol (EQ-5D) - (weighted total) | EuroQol (EQ-5D) - (unweighted total) |
|---|---|---|---|---|---|---|---|---|---|---|---|---|---|---|---|---|---|---|---|---|
| 1 | BL | 2019-10-22 | 14 | Male | Male | Heterosexual | In a relationship | No | No | Metro | Not studying or working | 1 | 1 | 1 | 1 | 2 | 11 | 87 | 0.879 | 6 |
| 2 | BL | 2019-10-17 | 19 | Female | Female | Heterosexual | In a relationship | Yes | Yes | Regional | Studying only | 1 | 2 | 1 | 1 | 1 | 14 | 65 | 0.846 | 6 |
| 2 | FUP | 2020-02-14 | 19 | Female | Female | Heterosexual | In a relationship | Yes | Yes | Regional | Studying only | 3 | 1 | 1 | 1 | 1 | 10 | 71 | 0.850 | 7 |
| 3 | BL | 2020-02-15 | 21 | Female | Female | Other | Not in a relationship | NA | NA | Metro | Studying only | 1 | 1 | 3 | 1 | 1 | 13 | 74 | 0.883 | 7 |
| 3 | FUP | 2020-06-14 | 21 | Female | Female | Other | Not in a relationship | NA | NA | Metro | Studying only | 1 | 1 | 2 | 1 | 1 | 10 | 64 | 0.906 | 6 |
| 4 | BL | 2019-12-14 | 12 | Female | Female | Heterosexual | In a relationship | Yes | Yes | Metro | Not studying or working | 1 | 1 | 1 | 3 | 1 | 18 | 40 | 0.796 | 7 |
Creating summary plots
To create plots, we use the depict method, supplying the
index number of the dimension we wish to plot.
depict(Y, type_1L_chr = "domain_by_time", var_idcs_int = 5L)## Warning: The `var_nms_chr` argument of `depict()` is deprecated as of youthvars
## 0.0.0.9127.
## ℹ Please use `youthvars::depict(x_vars_chr)` instead.
## ℹ The deprecated feature was likely used in the youthvars package.
## Please report the issue to the authors.
## This warning is displayed once every 8 hours.
## Call `lifecycle::last_lifecycle_warnings()` to see where this warning was
## generated.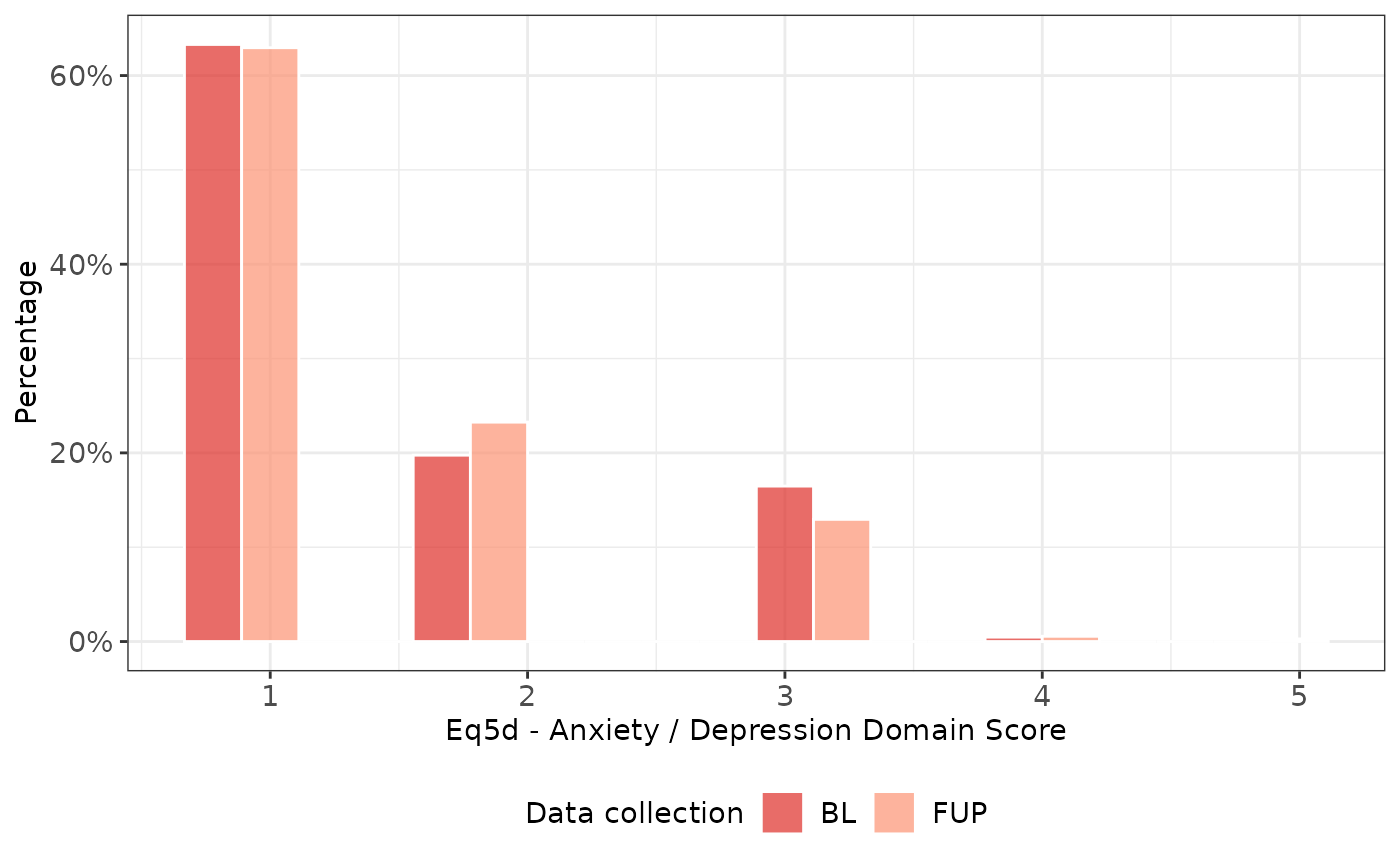
EQ-5D Anxiety / Depression Dimension scores by time
Total EQ-5D scores can also be plotted using the same approach, where
var_idcs_int = 1L is used to plot the weighted total
distribution.
depict(Y, type_1L_chr = "total_by_time", var_idcs_int = 1L)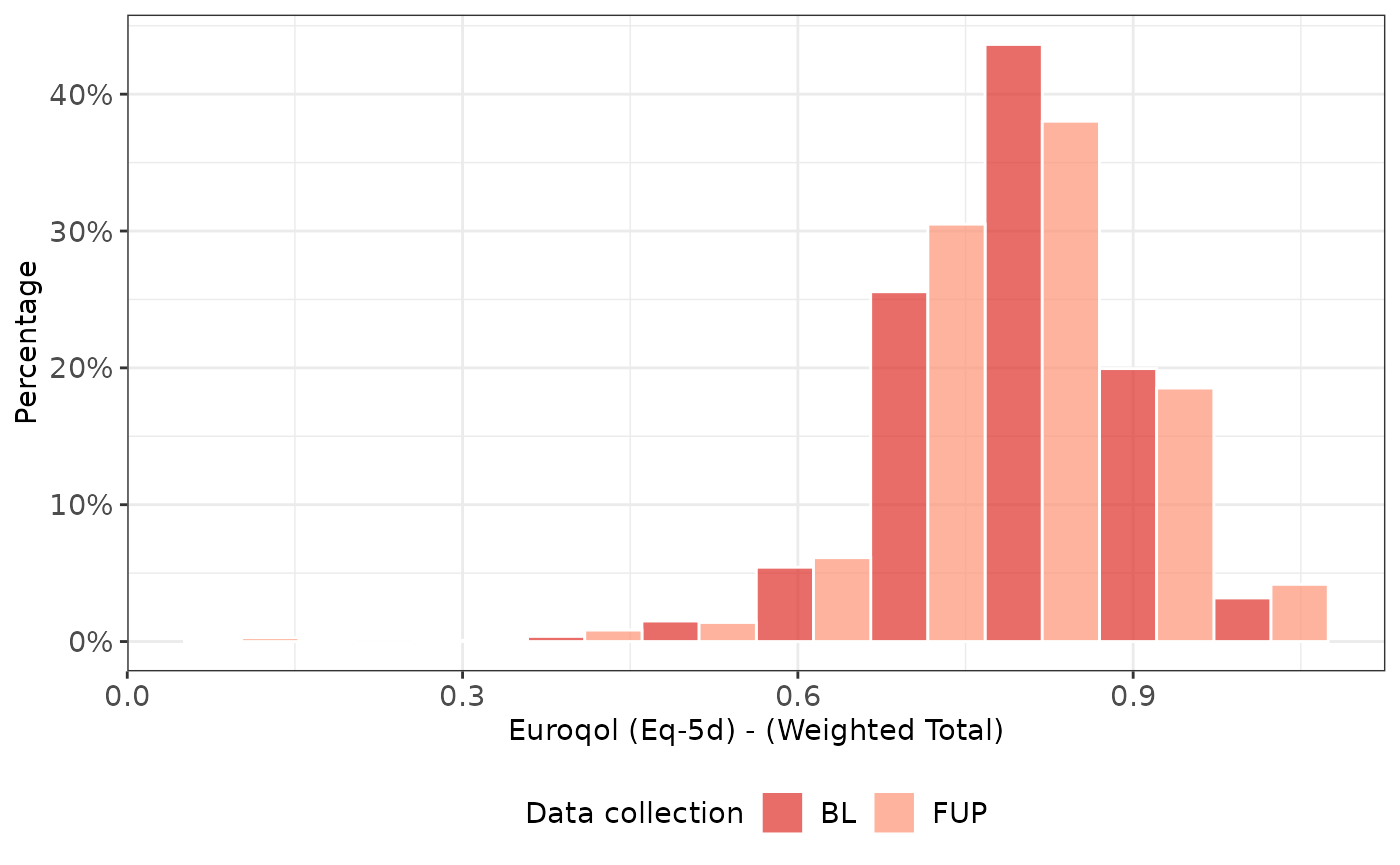
EQ-5D total weighted utility scores by time
A composite plot can also be generated.
depict(Y, type_1L_chr = "comp_domain_by_time")## Warning: The dot-dot notation (`..density..`) was deprecated in ggplot2 3.4.0.
## ℹ Please use `after_stat(density)` instead.
## ℹ The deprecated feature was likely used in the youthvars package.
## Please report the issue to the authors.
## This warning is displayed once every 8 hours.
## Call `lifecycle::last_lifecycle_warnings()` to see where this warning was
## generated.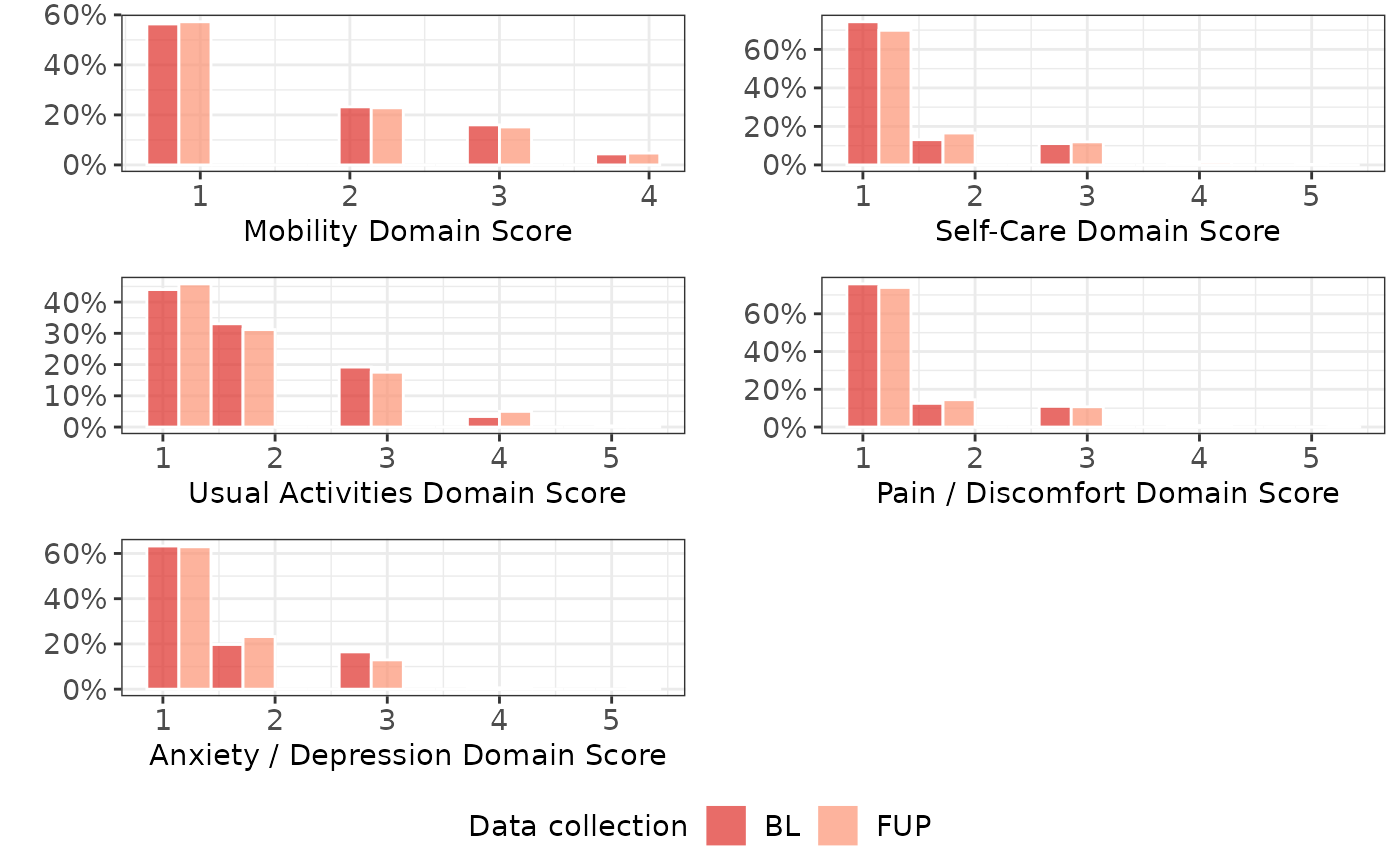
EQ-5D weighted domain scores by time
Share output
We can now publicly share our scored dataset and its associated
metadata, using Ready4useRepos and its share
method as
described in a vignette from the ready4use package.
Z <- ready4use::Ready4useRepos(gh_repo_1L_chr = "ready4-dev/scorz", # Replace with details of your repo.
                               gh_tag_1L_chr = "Documentation_0.0") # You must have write permissions.
Z <- share(Z,
           obj_to_share_xx = Y,
           fl_nm_1L_chr = "ymh_ScorzEuroQol5")
Y is now available for download as the file
ymh_ScorzEuroQol5.RDS from the “Documentation_0.0”
release of the scorz package.